Welcome to GPAFlow!
This tool is designed to help you accurately track, analyze, and predict your Grade Point Average (GPA). Your data is automatically saved in your browser, so you can close the tab and return later without losing your progress. Below is a detailed guide on how to use each feature of the application.
Section 1: Add Past Courses
This is where you input all your historical course data. You have two options: adding courses manually or uploading a CSV file for a much faster experience.
- Consider Semester Data: Toggle this option if you want to track your GPA on a semester-by-semester basis. When enabled, you'll need to provide a semester number for each course entry.
- Add Manually: Use the form to add groups of courses with the same grade and credit hours.
- Upload CSV File: For bulk data entry. Your CSV file must contain specific headers.
- If 'Consider Semester Data' is OFF, the headers must be:
Grade,Count,Hours/Course
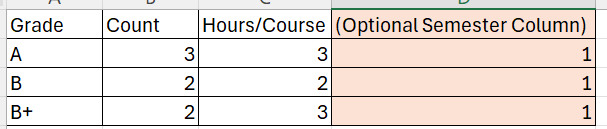
- If 'Consider Semester Data' is ON, the headers must be:
Grade,Count,Hours/Course,Semester
The app will validate the file and show an error if the format is incorrect.
- Course Summary Table: This table displays all the data you've entered.
- Sorting: Click on the column headers (Grade, Count, etc.) to sort the data in ascending or descending order.
- Editing: Click the 'Edit' button on any row to modify its data directly in the table. Click 'Save' to confirm or 'Cancel' to discard changes.
- Deleting: Click 'Remove' to delete a specific row.
- Adding: Click 'Add Course' below the table to add a new, editable row.
- Clear All: Use the 'Clear All Courses' button to reset all entered data. A confirmation will be required.
Section 2: Current Standing
This section provides a real-time snapshot of your academic progress based on the data you've entered.
- Cumulative GPA: Your overall GPA calculated from all courses entered.
- Total Courses & Hours: A running total of the courses and credit hours you've completed.
- Overall Progression: A visual representation of your progress towards graduation.
- Max Graduation Hours: Set your degree's required credit hours (e.g., 140) to track your completion percentage.
- Max Hours/Course: Set the maximum credit hours a single course can have at your institution (e.g., 3 or 4). This value constrains inputs across the app to ensure data integrity.
Section 3: GPA Prediction Tool
This is the core predictive feature of GPAFlow. It calculates all possible GPA outcomes based on a set of future courses.
- Number of Future Courses (n): Enter the number of courses you plan to take. Note: This is limited to a maximum of 7 to ensure the application runs smoothly on all devices.
- Credit Hours for these Courses: For each of the 'n' future courses, specify the number of credit hours. These inputs will appear dynamically after you set the value of 'n'.
- Run Prediction: Click this to start the calculation. The button will be disabled if you have not entered any past course data.
Prediction Results
After running a prediction, this section will appear with a detailed analysis.
- Prediction Summary: Shows the total number of unique GPA outcomes calculated.
- Results Table:
- GPA Range: The results are grouped into standard GPA brackets (e.g., 3.0-4.0).
- Likelihood: The probability of your future cumulative GPA falling within that specific range.
- Visualization: A bar graph providing a quick visual of the likelihood percentage.
- Filter by GPA Range Factor: This powerful slider allows you to shift the GPA ranges. For example, if you want to see the likelihood of getting between a 3.5 and 4.0, you can adjust the factor to fine-tune the brackets shown in the table without re-running the entire simulation.
Semester-by-Semester Analysis
This section automatically appears when you enable 'Consider Semester Data' and have entered relevant course information.
- GPA Chart: A line graph that plots your Semester GPA and Cumulative GPA over time, allowing you to visualize trends in your academic performance.
- Data Table: A table that provides the exact GPA values for each semester, corresponding to the points on the chart.